Visualize Energy
Intelligently.
WEVA (Wago Energy Visualization App) lets you visualize data from Modbus devices, track them on a live map, and store everything securely in MySQL. Running natively in Docker.
Interface Preview
Power at your fingertips
Built for reliability. Designed for visibility.
Docker Native
Runs seamlessly in Docker containers. Easy deployment, isolation, and scalability for any environment.
Modbus Visualization
Visualize data transmitted from your Modbus devices in real-time. Turn raw signals into actionable insights.
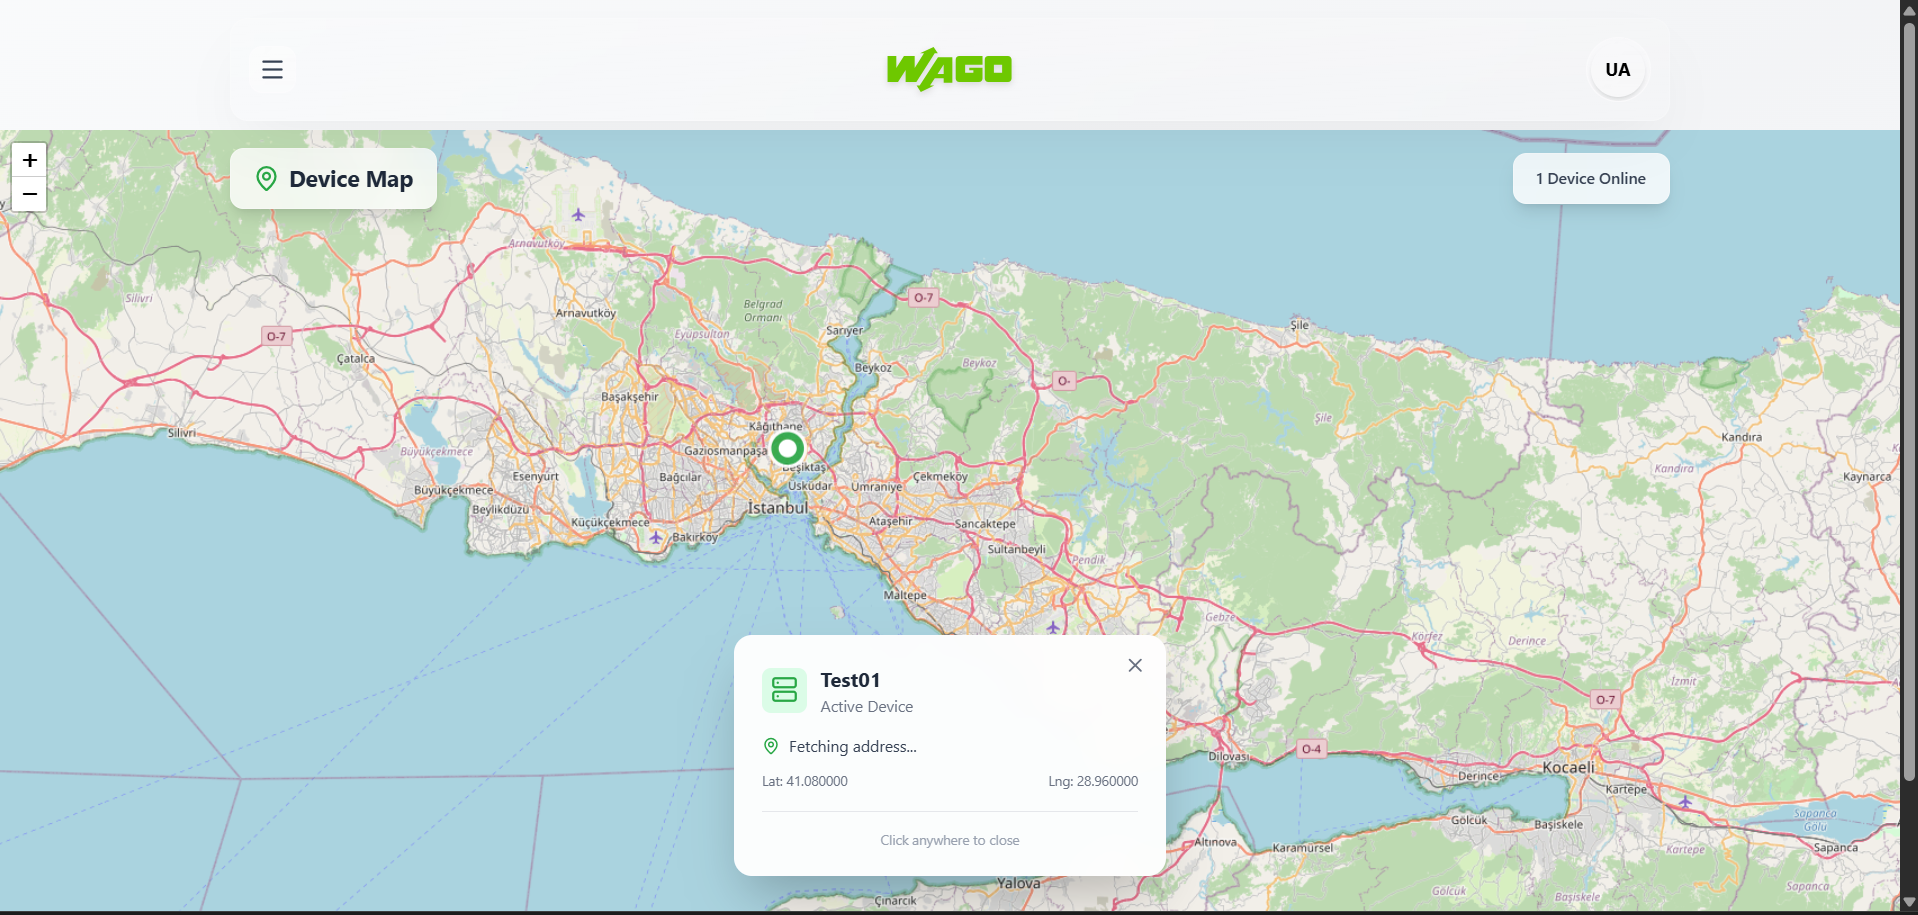
Interactive Map
Track your devices geographically. instantly see the location and status of every modbus device in your network.
MySQL Storage
Secure and robust data persistence. Store historical data from all your devices using a reliable MySQL database.
Image Support
Associate images with your devices or locations. Leave placeholders where necessary for future visual assets.
Centralized Dashboard
One screen to rule them all. Monitor performance, alerts, and connection status from a single intuitive interface.
Ready to visualize your data?
Deploy WEVA today and take control of your Modbus device network.